Mission Scientist

NAMMA Banner

Flight Hours by Mission Objective

October 5th, 2006

Date East. Wave # Cyclogenesis SAL/Dust Microphysics Total 
    Useful Dedicated Useful Dedicated Useful Dedicated  
15-Aug-06 Ferry to CV 1 0.5 1 0.5 0 0 1
19-Aug-06 w1 – pre-Ernesto 6.5 4.5 4 2 0.5 0 6.5
20-Aug-06 w1 – pre-Ernesto 6 3 6 3 2 2 8
23-Aug-06 w2 – TS Debby 8 8 6 0 0.5 0 8
25-Aug-06 w3 – non develop. 5.5 3.5 5 4 1 0 7.5
26-Aug-06 w3 – non develop. 7 4.5 5 0 2.5 2.5 7
30-Aug-06 no wave 0 0 5 2 5 5 7
1-Sep-06 w4 – non develop. 5.5 5.5 2 0.5 0 0 6
3-Sep-06 w5 – pre-Gordon 6 6 0 0 1.5 1.5 7.5
4-Sep-06 w5 – pre-Gordon 5.5 5.5 3 0 0 0 5.5
5-Sep-06 no wave 0 0 6 5.5 1 0.5 6
8-Sep-06 w6 – non develop. 6 6 0.5 0.5 0.5 0.5 7
9-Sep-06 w6 – non develop. 5 5 0 0 0 0 5
12-Sep-06 w7 -  TD8 became H. Helene 7 7 0.5 0.5 0.5 0.5 8
14-Sep-06 Ferry to US 0 0 0 0 0 0 0
Total (dedicated) hours 69 59 44 18.5 15 12.5 90
Approx. Hours per A/C Plan   56   17   17 90

One caution that everyone should appreciate is that there might be some small corrections still needed on the dedicated hours, but especially on the “useful for” hours. As I think about this, I have been inconsistent in the following way: When a wave mission flies over dust layers, I usually added some “useful for dust” hours even if we did not alter the flight tracks. To be consistent, there are some portions of the wave flights when we penetrated some thick anvils or large-scale cirrus/altostratus without altering the flight tracks.

Obviously, the ice water contents and ice particle size distributions on those segments will be useful to the microphysics goals, so with help of folks like Andy Heymsfield, Cindy Twohy, and Aaron Bansemer, we should make some educated guesses about the flight legs useful for such purposes

–Ed Zipser

P.S. An Excel file with these totals is uploaded to this report (see below)

DC8_hours_byobjective Zipser4Oct06.xls

12Sep06 Mission Science Report – 13th science flight

September 12th, 2006

Mission Scientist Report 12 September 2006

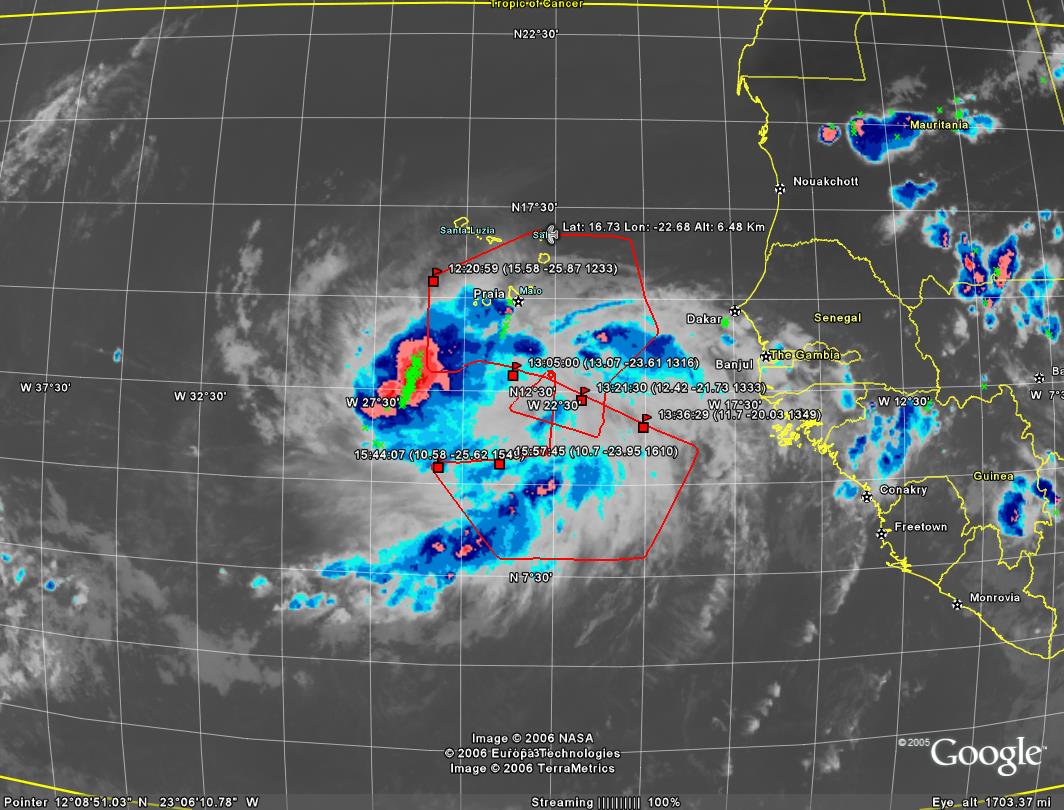
This was the first and only flight into the wave that developed into Hurricane Helene. During the flight, NHC classified this storm as TD #8 and forecasted the storm would reach Category 1 in two days. This wave was followed over the continent for several previous days, and there were earlier reports earlier of strong MCSs passing by the MIT radar located much further inland in Mali. The flight planning on 13 September was designed to study this wave as it reached the coast on the 14 October. On the 13th, there was already evidence from the visible satellite data of a weak vortex over land. This made flight planning more restrictive because of the circulation being partially over land and the possibility of strong convection. By the morning of the 14th, the wave axis and circulation already cleared the coast with roughly 12 degrees westward movement in just one day. Dry air intrusion was beginning on the north side near Sal. It was decided to fly a more generic flight pattern on the 14th with two main passes across the estimated circulation center, sampling of the of the larger scale flow, sampling the SAL on the north side, and a 2 hour delay near the center point to descend down the FL100 and lower to map the vortex winds and thermodynamics. Seven dropsondes were released during the flight, about 7 short of what was anticipated, since the operator was sick and forgot to tell his replacement to load a new box of sondes on the plane. As a result, the DC-8 was in a porpoising mode with with descents down to FL50 and remaining dropsondes launched at FL250.

There were a number of interesting features of the overall storm and circulation observed with the DC-8 measurements. The first part of the flight near Sal showed a deep dust layer up to 4 km altitude with LASE. Then the DC-8 crossed over a strong convective line on the northwest of the circulation center. This line propagated toward the northwest, was highly electrically active, and was also within distant range of the TOGA radar. TOGA reported cloud tops up to 45kft with a broad trailing stratiform region, and an advection speed of the line was 26 kts. APR-2 saw convection and stratiform precipitation with this line, and MMS detected 5 m/s updrafts with some of the convection. On the east side of this line, the DC-8 spiraled down to FL100 to perform a microphysics spiral and also to map the low level circulation properties. The circulation was much better defined and stronger than those on previous flights although no prominent warm core was observed. The vortex was strongest above 850 mb with tangential winds as much as 30 kts on the north side, roughly a 100 km diameter, and was actually fairly weak near the surface (5 kts). After working the low levels, the DC-8 ascended back to the FL250 to continue on flight legs back to Sal. While passing near a small cell that appeared to have minimal electrical activity, the DC-8 took a hit by lightning at approximately 1818 UTC. Finally, a MMS maneuver and spiral down over SMART-COMIT was performed at the end of the flight. Overall, the flight was very successful and will provide excellent information on an intensifying vortex originating from an AEW.
Gerald Heymsfield

DC-8 Flight Mission Scientist

12Sept06 flight track complete IR and lightning.jpg

9Sep06 Mission Science Report – 12th science flight

September 9th, 2006

9Sept06 flight track.jpg

8Sep06 Mission Science Report – 11th science flight

September 8th, 2006

Mission Scientist Report 8 September 2006

The flight on 8 September was to study the structure of a weak wave exiting the coast south of Dakar. Preflight plans were to study this wave and possible circulation south of Dakar with a 5-sided loop and then another loop further to the north and east to map out the larger scale wave structure over the continent. There was convection south of the NPOL radar so a 30 minute delay was built into the flight plan at 13N, 18W to perform a microphysics module.

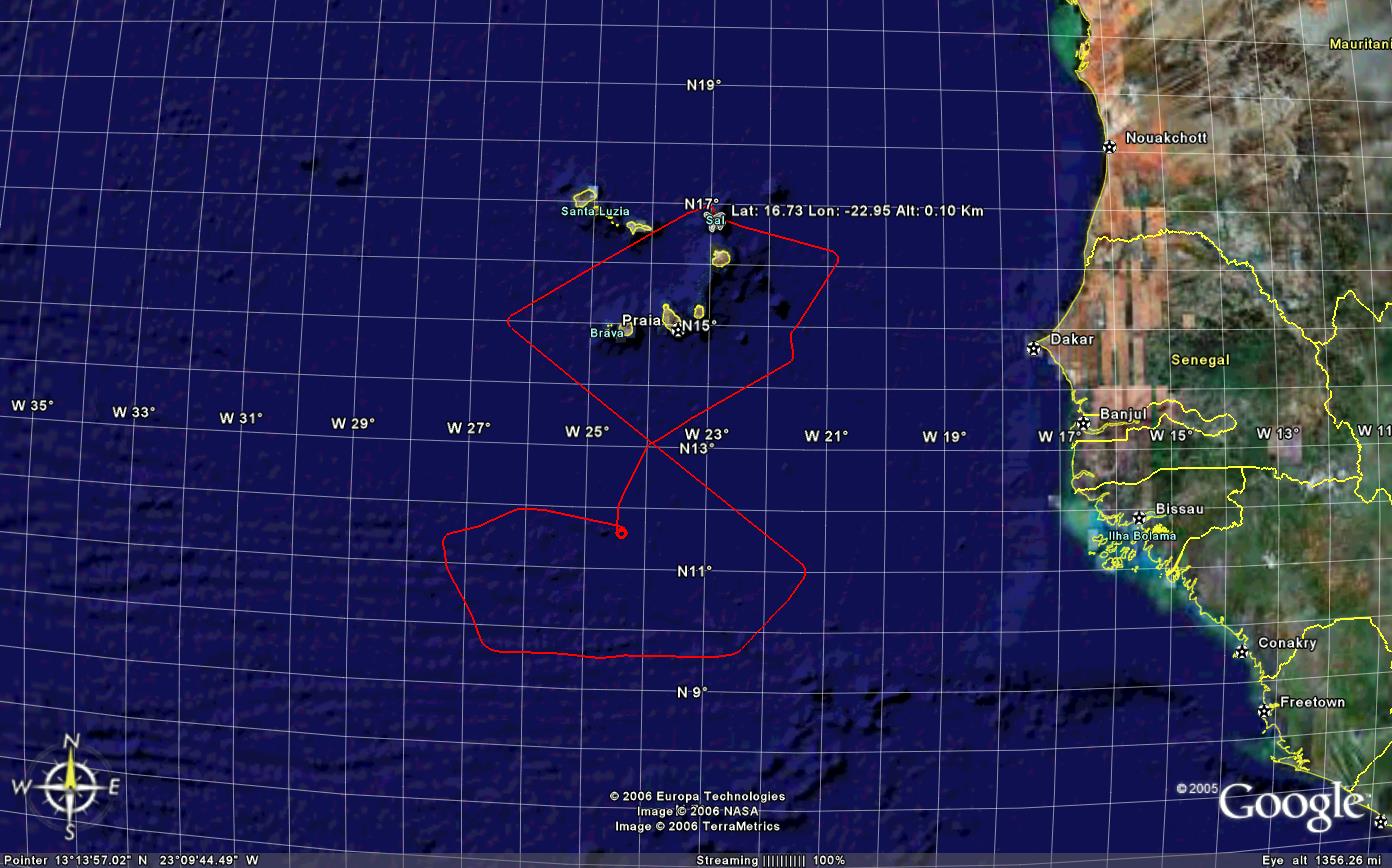
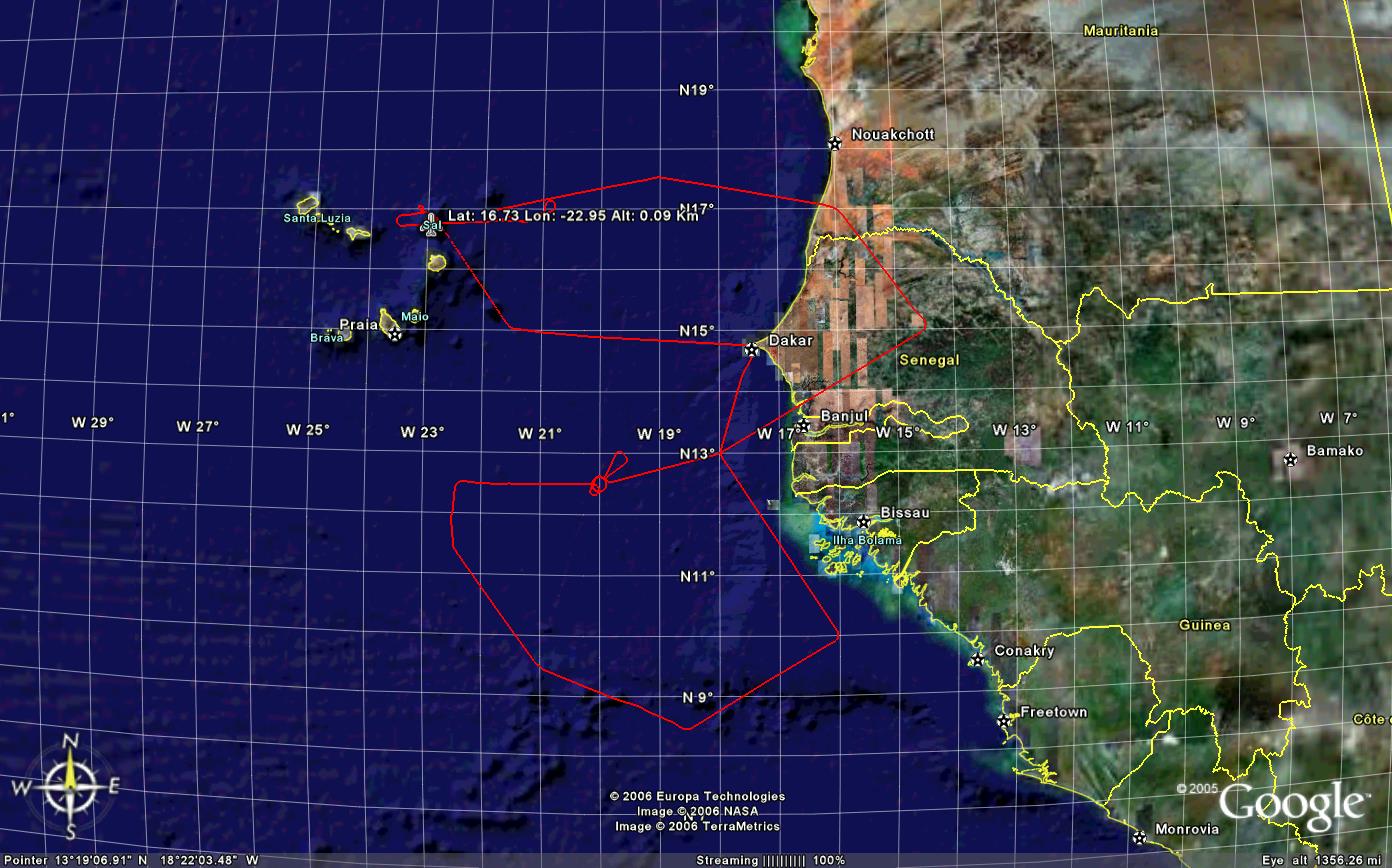
Closer to takeoff time, a large MCS with embedded convection and lightning developed further to the east than anticipated near 11N-12.5N, 19W-21W within our planned loop. The south loop was flown in a clockwise direction with dropsonde releases at corner points to map out a circulation center if present. A total of 16 dropsondes were released and they indicated a weak circulation at 700 and 850 mb with a center near 11N, 19W. A strong isolated convective cell win an updraft of 12.5 m/s was encountered on the southernmost part of the loop. During the last flight leg of this loop, we performed a spiral down through a stratiform region to the northeast of the MCS and strongest convection. The stratiform was not especially uniform but the data was still reported to be useful. The plane continued on its course over Senegal, the southwest corner of Mauritania, and back to Sal. There was significantly more dust on the northern side near 17N as reported by LASE.

Overall, the flight was excellent for studying a weak AEW event. The plans are for following this wave another two days if it holds together to determine if there are any changes in the intensity of the circulation.

Gerald Heymsfield

8Sept06 flight track.jpg

5Sep06 Mission Science Report – 10th science flight

September 5th, 2006

9-05-06_DC8.jpg

5Sept06 flight track.jpg

4Sep06 Mission Science Report – 9th science flight

September 4th, 2006

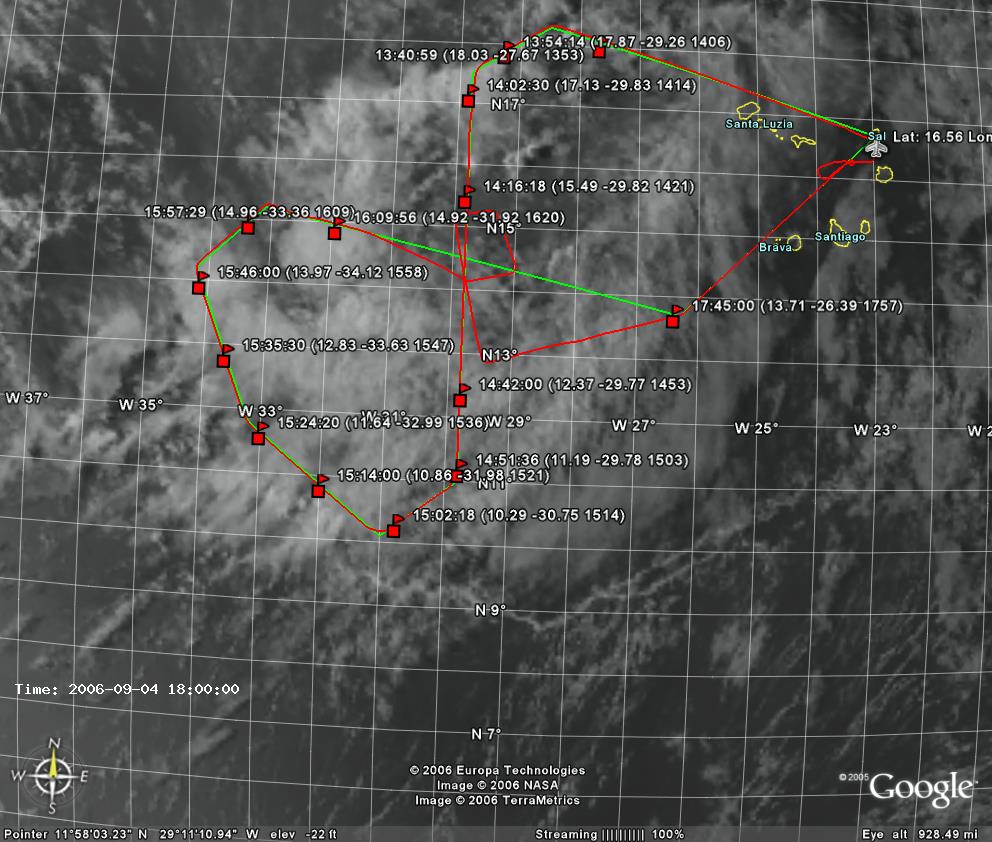
The 4 September flight was the second flight to sample the same circulation observed on the previous day. This circulation was approximately near 14-15N, 29-30W and trailed TD-6 further to the west.

The precipitation organization was somewhat different than the last flight with the strongest precipitation on the southwest side of the circulation center. The DC-8 first performed a one-hour north-south pass at 33kft across the estimated circulation center. During the second main west-east track, the DC-8 dropped down to 10kft (700 mb) for two shorter passes to define the circulation center. The circulation was fairly large but loosely organized with winds at the 700 mb level of about 20 knots. The convection was generally weak at the 32kft level with occasional 5 m/s updrafts and downdrafts. All instruments appeared to function normally. APR-2 detected spotty preciptation ranging from light to heavy at times. Eighteen dropsondes were launched with three failures of the old sondes.

One major difference between the previous day and this flight was that there was much more dust. LASE and LARGE noted large dust particles on this flight interspersed between precipitation regions. This dusty air was noted in several quadrants of the circulation. The last flight covering this same circulation showed relatively clean throughout the circulation and surrounding region. We decided not to fly this system again on 5 September since the circulation is still unimpressive and the consensus of models show this circulation merging with TD-6 in several days.


Gerry


9-04-06_DC8.jpg

3Sep06 Mission Science Report – 8th science flight

September 3rd, 2006

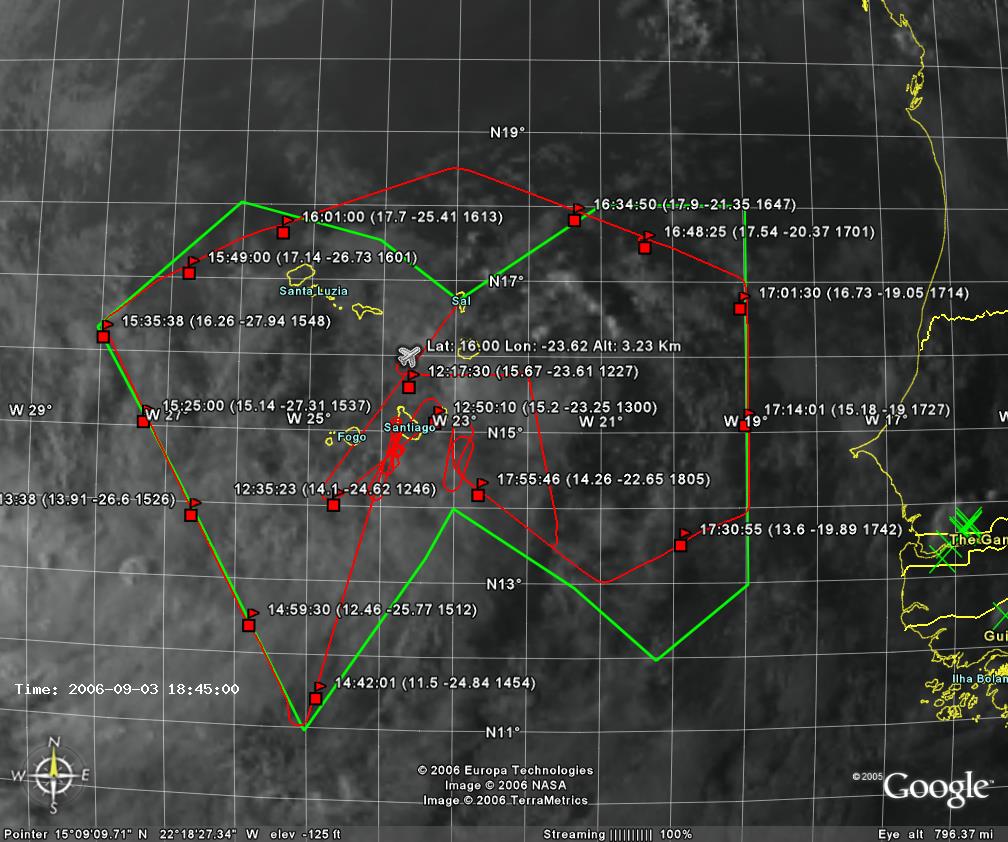
Mission Scientist Report – DC8 flight 06-41, on 3 September 2006

03 September 2006 Takeoff 120008 UTC Landing 194920 UTC

The principal objective was to map the wave whose circulation center was almost on top of the Cape Verde Islands. Aa secondary objective was to take advantage of the heavy precipitation observed near the TOGA radar to do one of the cloud microphysics modules.

With timely and accurate guidance from Brad Smull at the TOGA radar, we knew before takeoff that we would alter the original flight plan to go immediately to the radar for the microphysics work. A few minutes into the flight Brad passed a flight line to the aircraft and we started on it less than 30 minutes after takeoff. That was followed by a pre=planned module for a bow tie for remote sensing, spiral descent for in situ particle sampling, and second bow tie for remote sensing and assessment of temporal changes. Although having satellite images on board the DC-8 have been an immense assistance during this program, it must be reported that without guidance from the TOGA radar, satellite data along could not have selected the correct location for this module, a large area of mostly stratiform precipitation. We look forward to collaboration with the TOGA scientists in the analysis of this case.

The remainder of the flight covered all quadrants of the system, which was near 15 N 23 W with a diffuse center. The flight covered latitude range of 11-18.5 N and 19-28 W. Some fairly heavy precipitation was encountered mostly in the SW quadrants, none of it turbulent, although lightning was noted in the vicinity before our arrival. The remarkable feature of the flight was the absence of any strong aerosol layers on any quadrant sampled. LASE was able to map the (lack of) aerosols and the moisture profile in most of the flight.

ABout 20 dropsondes were used to map the disturbance. To get more detail at lower altitudes than we could obtain from the dropsondes, some short legs were flown at 10,000 ft during the last part of the flight, showing a strong gradient between SSW winds at 30 knots SE of the center and the light easterlies near 16 N.

Ed Zipser (Flight Mission Scientist)

9-03-06_DC8 Flt1.jpg

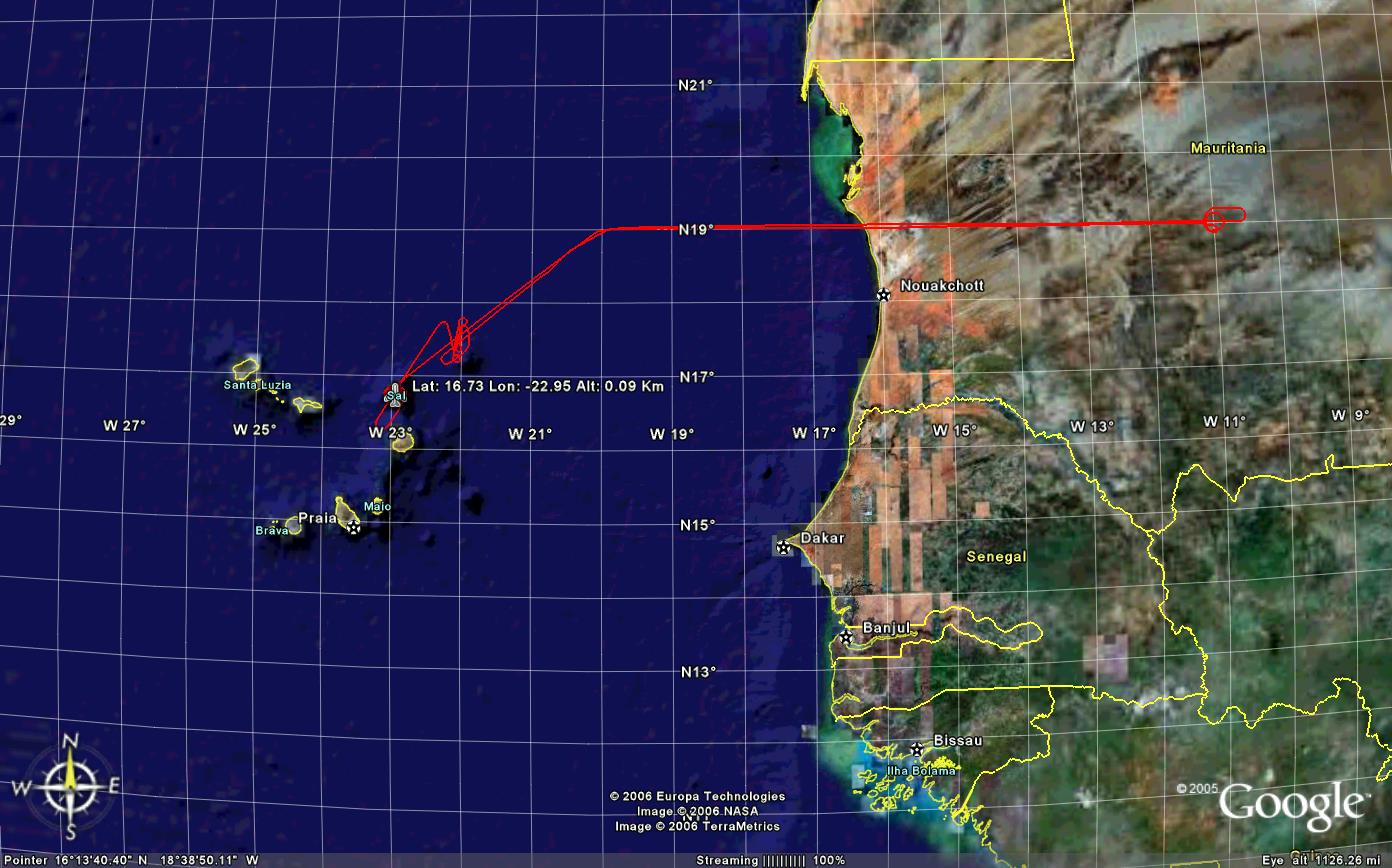
1Sep06 Mission Science Report – 7th science flight

September 1st, 2006

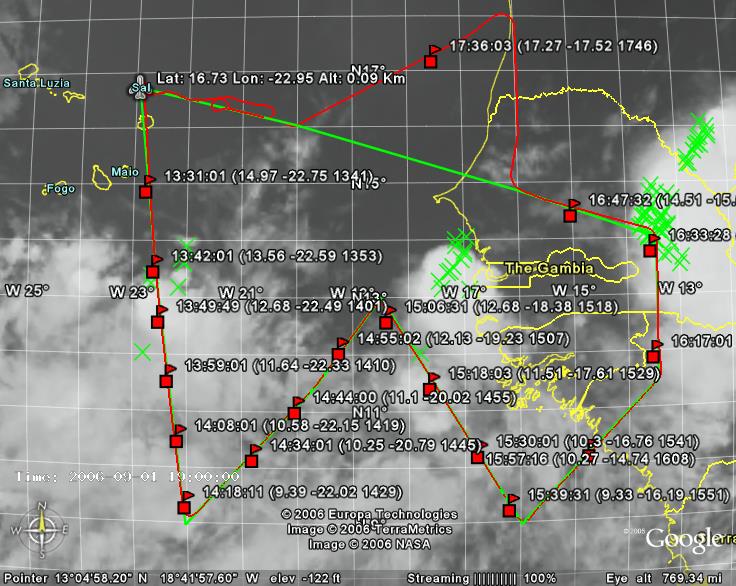
Mission Science Report, DC8 Flight on Friday 1 September 2006

Yesterday (1 Sept) we anticipated flying the first of 3 days on a forecast wave. The exact location was not clear before the flight and not much clearer after the flight. Instead of a wave, we documented an E-W trough at low levels near 11-12 N south and southeast of the CV islands. To complete the pattern, we also obtained dropsonde data in Guinea, Senegal, and Mauretania on the eastern portion of the pattern. Before exiting the coast, the ops center informed us of a new dust outbreak just north of our track, so we jogged north to 18 N, observing the heaviest dust returns seen in the project thus far, with the surface obscured.

Today we had a difficult decision to make because the models once more seem to insist that it is not the “wave” near us that is a good target, but the one for tomorrow and the next day. IN the absence of any obvious continuity on yesterday’s weak system, and the consensus forecast that the next two days would have a better target (near 21 and 28 W respectively), we elected to take a no-fly day today.

Ed Zipser (Flight missioin scientist)

Flight track on 1 September 2006

30Aug06 Mission Scientist Report – 6th science flight

August 30th, 2006

Mission Scientist Report- Flight of August 30

Following the passage of the strong wave of August 27, the flow pattern in west Africa and the vicinity of the Cape Verde Islands has become more zonal, with a strong mid-level easterly jet and a series of small amplitude waves. In the absence of any useful easterly wave target, the main objective of this flight was to accomplish a number of important NAMMA objectives for microphysics and SAL/dust.

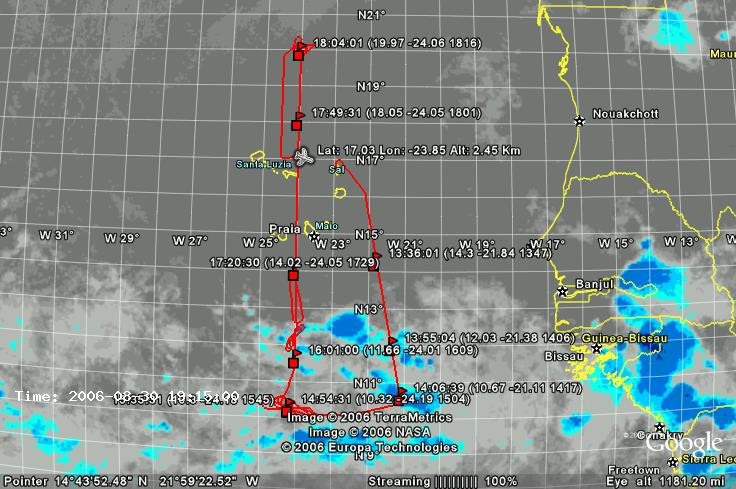
Considerable deep convection was apparent between 10-12 N before takeoff, and there was an obvious outbreak of Saharan dust covering most of our area north of 13-14 N. We elected to give highest priority to several microphysics modules (see below) while also obtaining a long S-N transect across the gradient of the SAL/dust layer. All objectives were accomplished. Takeoff 1305 UTC Landing 2010 UTC.

1. Our preliminary track was aimed at 10 N 21 W but best precipitation targets were east and west of that location. We selected a cloud system (a very small MCS) oriented along 10-10.5 N between 23 and 24.5 W. We executed the melting band module, first crossing the system, selecting the precipitation target with the PR2 radar, then doing a bow tie at 25000′, then spiraling down at 600 ft/minute between -10 C and +5 C, then repeating the bow tie. The region was a mixture of convective and stratiform precipitation, so while we would have preferred a larger more uniform system, no such was available.

2. After leaving the first system, we did a number of penetrations of isolated cumulonimbus clouds near 12 N 24 W from 23000′ down to cloud base, targeting the -15, -5, +2 C levels. The cloud base run will probably establish that the air was quite clean here.

3. Next (after the usual time-consuming difficulties getting air traffic clearances from Dakar) we climbed to a higher altitude to get a long S-N run along 24 W across the gradient from 12.5 to 20 N. Both LASE and dropsondes documented the marked changes in regime, including some remarkably fine structures in the humidity and aerosol fields. This was followed by a spiral through the SAL at 20 N from 20000′ to 500′. The boundary layer was capped by a broken stratocumumulus layer at 3200′ with a sharp inversion and very dry air immediately above the inversion. A long horizontal run obtained aerosol and chemical samples in the heavy dust layer at 7500 ft.

4. To contrast with aerosol and cloud microphysics samples in and near low clouds in clean regions, we obtained 10 minute runs at 500 ft, in the cloud layer, and just above the cloud layer at 20 N 24 W.

 Ed Zipser

30Aug06 Flight Track


26Aug06 Mission Scientist Report – 5th Science Flight

August 26th, 2006

Mission Science Report, DC8 flight of Saturday August 26.

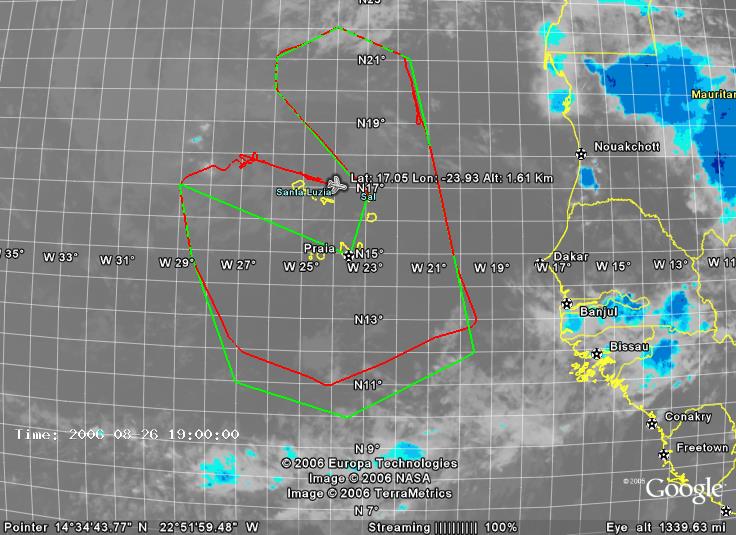
This was a second successful mission in the large wave/circulation centered near the Cape Verdes. The primary objective was mapping of the circulation, thermodynamics, and aerosols within and surrounding the system. The flight pattern covered a latitude range from 11-22 N and a longitude range from 20-29 W. About 17 dropsondes were used, all but one with good data. These data are available on the NAMMA web page under the “data” link. The wind circulation changed little from the previous day, and with few exceptions the entire region was devoid of deep convection.

The ITCZ appeared to be well south of the wave between 8-10 N and we did not penetrate it on this flight. There were extensive low clouds with little precipitation (more on these below). Near the apparent vorticity maximum (approx 18N 28W) there were a few cumulonimbus clouds and a mesoscale rain area we penetrated (inadvertently—not obvious on the Meteosat IR image).There were two cloud physics objectives achieved on this mission. We did a Cloudsat underflight on the northeast side of the system near 20 N 21.5 W at 1457 UTC 8/26. During the overpass, the aircraft was in a fairly continuous thin layer of cloud near 23000 ft at a temperature of about -16 C, almost entirely water cloud with a few ice crystals. Toward the end of the flight we did two complete low level microphysics modules (per below, within, and above low clouds. We have preliminary indications that these low clouds were in regions of low-moderate aerosol concentrations.

Ed Zipser (Flight mission scientist)

26Aug06 Flight Track

Have you used our data? Register for updates